The system behind the work.
Color.
Six chromatic families on a 50–900 scale. Semantic aliases the components reference. The brand is monochrome by default — the hero gradient is the only place chromatic color appears.
iris
iris-50
#f2f5ff
iris-100
#dfe7ff
iris-200
#c1ceff
iris-300
#a1b2fe
iris-400
#8295fb
iris-500
#6878ee
iris-600
#515fcf
iris-700
#3f4aa2
iris-800
#2d3673
iris-900
#1c2248
azure
azure-50
#eaf8ff
azure-100
#ceedfe
azure-200
#9fdafa
azure-300
#67c4f2
azure-400
#00adeb
azure-500
#0094dc
azure-600
#0079be
azure-700
#005f95
azure-800
#00446a
azure-900
#002b42
jade
jade-50
#ecfaf1
jade-100
#d3f1de
jade-200
#a8e1be
jade-300
#76cd9c
jade-400
#2eba7a
jade-500
#00a45b
jade-600
#008943
jade-700
#006b34
jade-800
#004d26
jade-900
#003019
amber
amber-50
#fdf4e9
amber-100
#f8e5cb
amber-200
#efca9a
amber-300
#e1ad63
amber-400
#d58e00
amber-500
#c37000
amber-600
#a65700
amber-700
#824400
amber-800
#5c3100
amber-900
#3a2000
rose
rose-50
#fff1f2
rose-100
#ffdee1
rose-200
#febdc4
rose-300
#f599a5
rose-400
#ec7385
rose-500
#da4e69
rose-600
#bb3352
rose-700
#932840
rose-800
#691f2e
rose-900
#42151d
gray
gray-50
#f9fafb
gray-100
#f3f4f6
gray-200
#e5e7eb
gray-300
#d1d5db
gray-400
#9ca3af
gray-500
#6b7280
gray-600
#4b5563
gray-700
#374151
gray-800
#1f2937
gray-900
#111827
Semantic aliases
bg
#ffffff
fg
#111827
muted
#6b7280
muted-soft
#9ca3af
surface-soft
#f3f4f6
border
#e5e7eb
border-soft
#f3f4f6
accent
#515fcf
Hero gradient
hero-blue
#0043fa
hero-cyan
#daf5fe
hero-purple
#54187c
hero-magenta
#ab26a5
hero-pink
#f269a7
hero-blush
#fcc9c9
hero-cream
#fff4f0
Typography.
One component — Text — with 18 variants. Geist Sans editorial, Geist Mono for data. Fluid variants interpolate with the viewport.
Editorial scale
Design that reasons.
A system behind the work
Built to compose
Reaction-time study
128 ms
Clarity is a feature.
Fluid scale
Design that reasons.
A system behind the work
Built to compose
Reaction-time study
128 ms
Clarity is a feature.
Body & utility
Body copy is the workhorse — long-form reading set for comfort and rhythm across the measure.
Body-strong emphasises a line without leaving the body scale.
Section eyebrow
Strong eyebrow
const token = value
Type scale
Spacing & Radius.
4px base spacing scale. Zero border-radius everywhere — no rounded corners is an explicit brand rule. Depth comes from layout and dividers, not shadows or blur.
Spacing scale
Radius
Motion.
Five duration tokens tuned for an editorial pace. No shadows, no blur. Motion is additive, not decorative — useReducedMotion is respected across all animated components.
instant
Micro-feedback — taps, toggles
fast
Hovers, small state changes
normal
Default transitions
slow
Larger moves, overlays
entrance
First-paint reveals
Gradients.
Eight named gradients from @joeldfs/brand. Each is two linear-gradient layers composited at hard-light, generating perceptually smooth OKLCH blends. Horizon is the editorial signature — used once, at the top of every page.
Horizon · the signature blend
The editorial hero gradient — cool over warm, hard-light. The only place chromatic color appears across the brand.
Calm · trust
Cool blue over cyan. Onboarding, security, reassurance.
Focus · clarity
Indigo over violet — the brand's intellectual core. Research, depth.
Energy · drive
Amber over ember. Momentum, launches, calls to action.
Growth · renewal
Teal over green. Progress, metrics moving up, sustainability.
Optimism · warmth
Soft yellow over coral. Community, delight, human stories.
Passion · intensity
Rose over magenta. Brand moments, emphasis, craft.
Depth · focus
Deep violet over indigo. Premium, night, concentration.
Voice & Tone.
Calm, declarative, slightly distant. Every string in the portfolio follows these rules — from nav labels to case study headings.
Calm, declarative, slightly distant. Confident without selling.
First person for the author (“I led”, “I designed”); third person for the work. Never address the reader as “you” or “we”.
Sentence case with a trailing period — “Design + Data.” The period is structural, not decorative.
Uppercase, 0.18em tracking — “/02”, “SELECTED WORK”, “ROLE & SCOPE”.
Em-dash for asides. Middle-dot · for short inline series. Smart quotes for testimonials.
Nouns over verbs. Three-clause rhythm. Short declaratives.
Exclamation points. Emoji. Marketing verbs: transform, unlock, supercharge, revolutionize. Hedging: just, simply, basically.
Layout.
Panda-powered layout primitives. Props accept token names; styles resolve at build-time.
Grid
columns + gap token
Stack
direction + gap token
Box
generic styled primitive
Container
max-width constrained page wrapper
Text & Prose.
Eyebrow
default + strong
Prose
long-form editorial HTML
Prose wraps editorial HTML — headings, lists, and links — in the system reading styles.
- Comfortable measure and reading rhythm
- Consistent link and emphasis treatment
PullQuote
quote + attribution
Content.
Callout
note · tip · warning
CodeBlock
lang + title + caption + copy button
MathBlock · MathInline
KaTeX rendering
Inline math \log_2(n + 1) sits in a sentence; block math is centred and numbered:
RefList
numbered references
- [01]Hick, W. E. · On the rate of gain of information. Quarterly Journal of Experimental Psychology, 1952
- [02]Hyman, R. · Stimulus information as a determinant of reaction time, 1953
Media.
GradientBand
hero gradient at any height
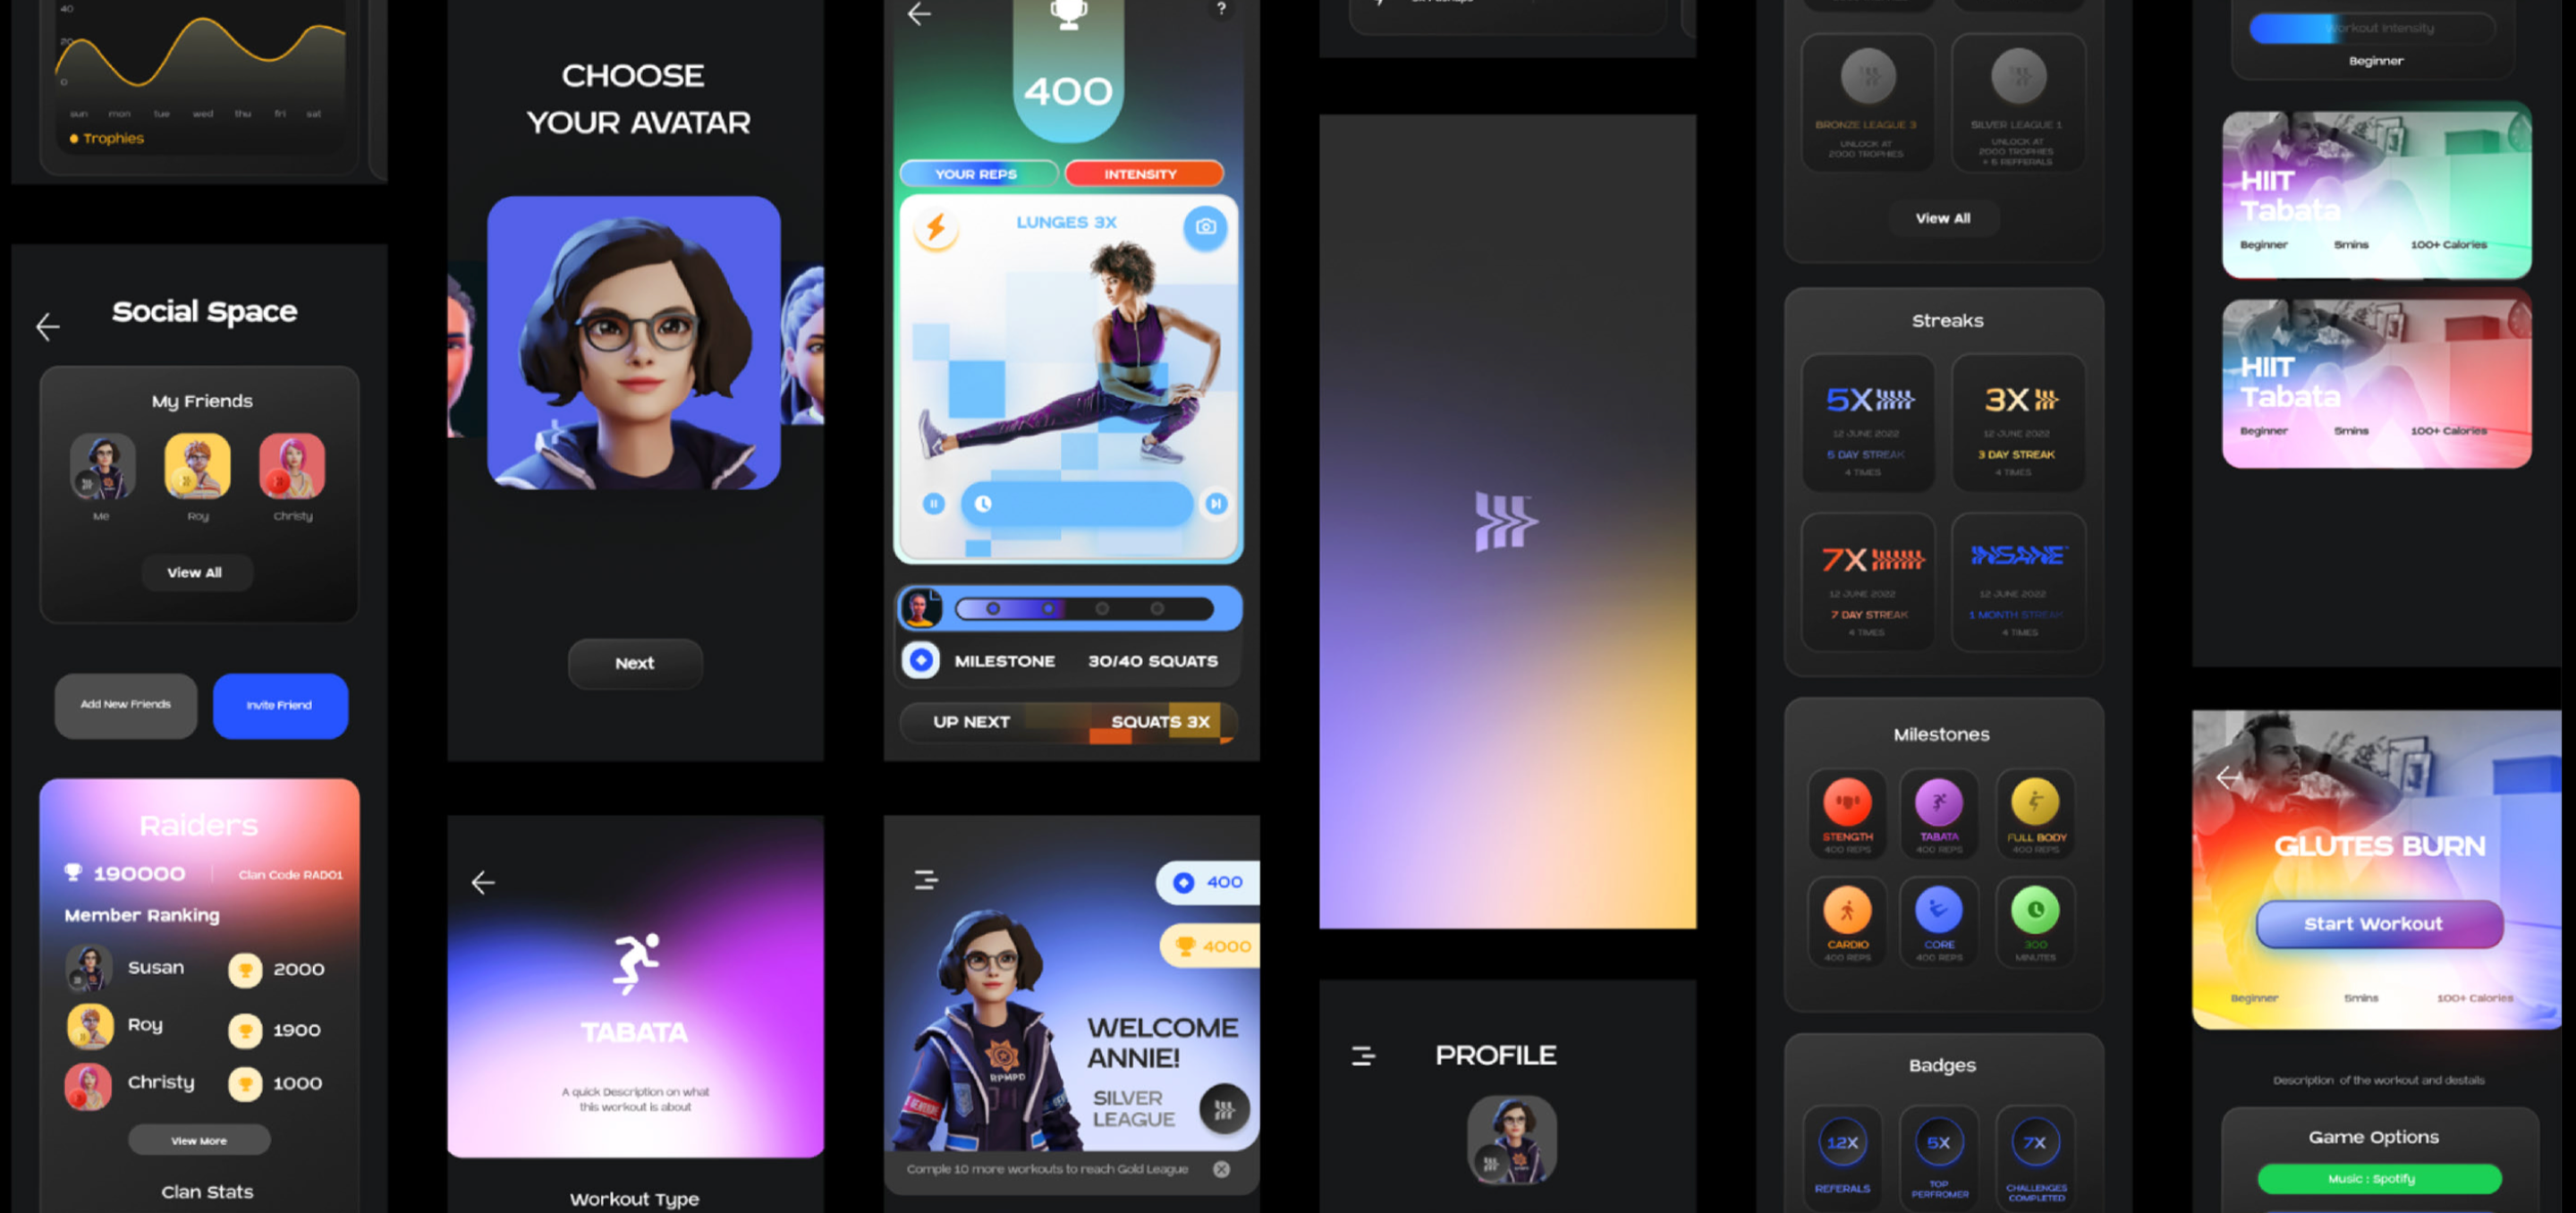
ImageFrame
bordered media container — images grayscale at rest
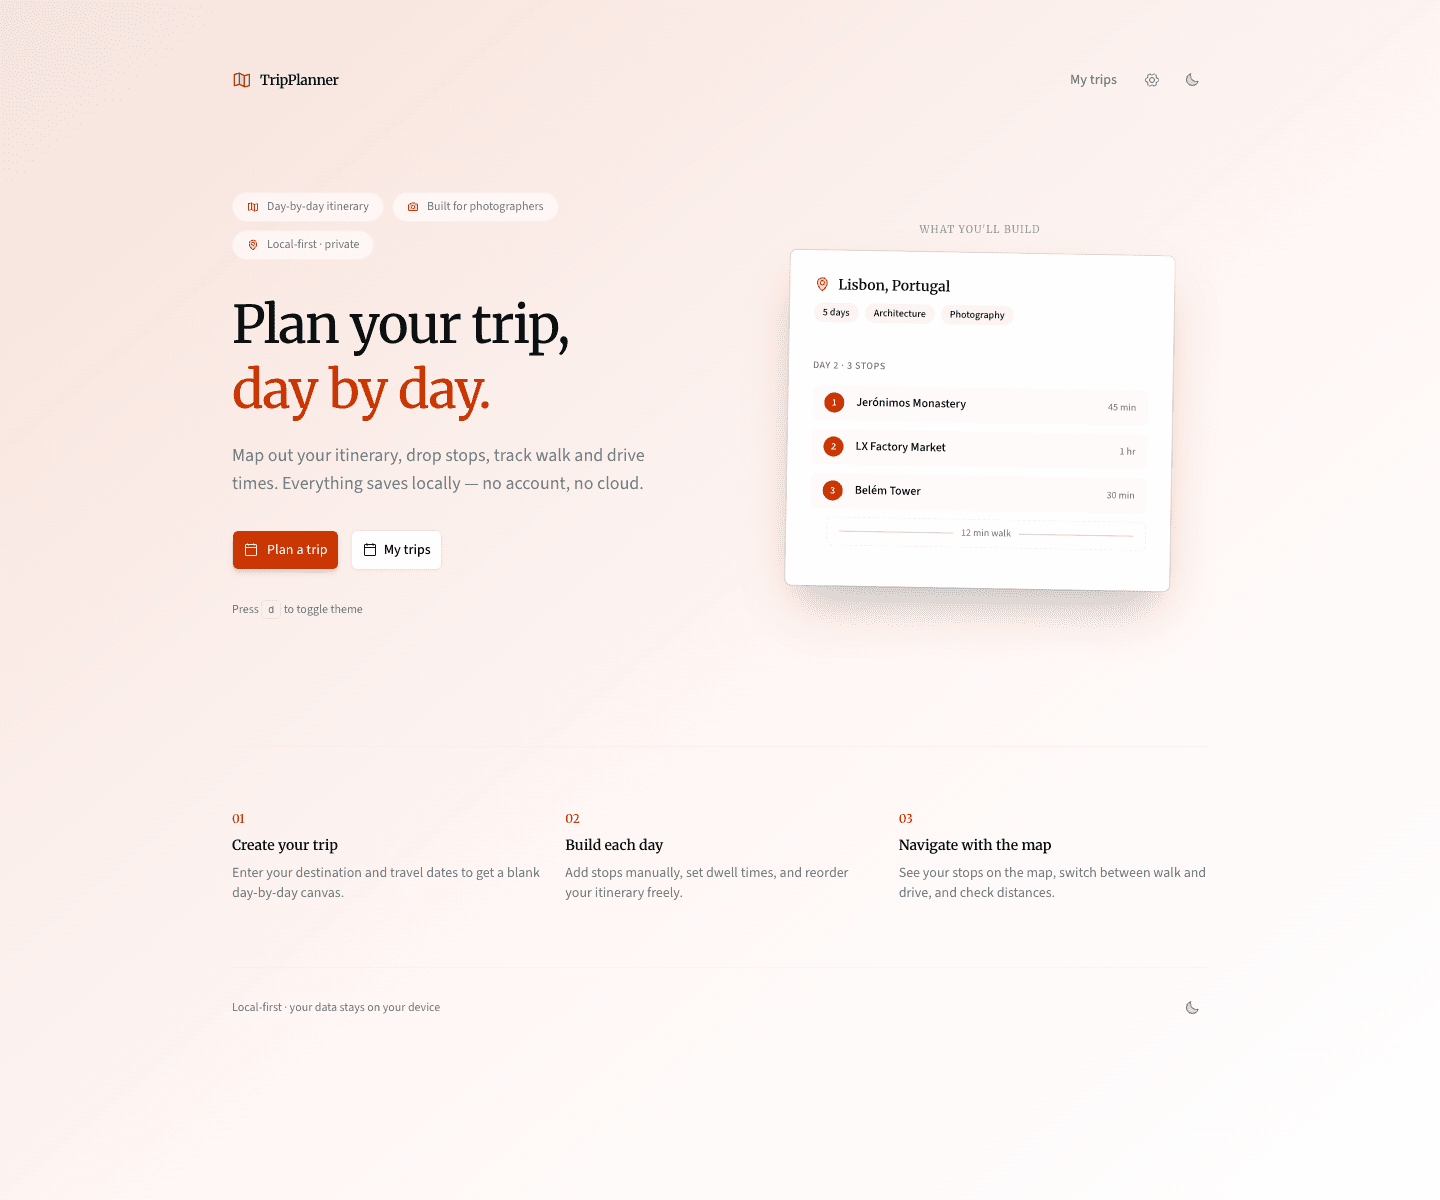
ImageFrame fallbackGradient
hero gradient placeholder when no src
Figure
numbered exhibit — number · title · caption · source
GalleryStrip
pair · triple · asymmetric · wide layouts
Visual storytelling.
AwardBadge
recognition marks

Data.
MetricsRow
bordered treatment
MetricsRow filled
full-bleed colour-cell treatment
DataTable
caption · columns · rows · footnote
| Column | Type | Meaning |
|---|---|---|
| set_size | int | Number of on-screen choices |
| rt | float | Reaction time in ms |
| correct | bool | Whether the response matched |
MetaStrip
labelled key-value row
Editorial Blocks.
Larger compositions for case studies — challenge/approach/outcome, journey maps, team credits.
CAOBlock
Challenge · Approach · Outcome
RoleScope
role + scope label pair
JourneyStrip
numbered process phases
- /01Discovery.Stakeholder interviews, audit
- /02Definition.Problem framing, scope
- /03Design.Concepts, prototypes
- /04Delivery.Handoff, QA, launch
TeamCredits
role + name team list
- Product DesignJoel D'Silva
- Engineering—
- Product Strategy—
Utility.
Link
default + muted
BackLink
detail-page return affordance
Divider
section rule
Above the rule.
Below the rule.
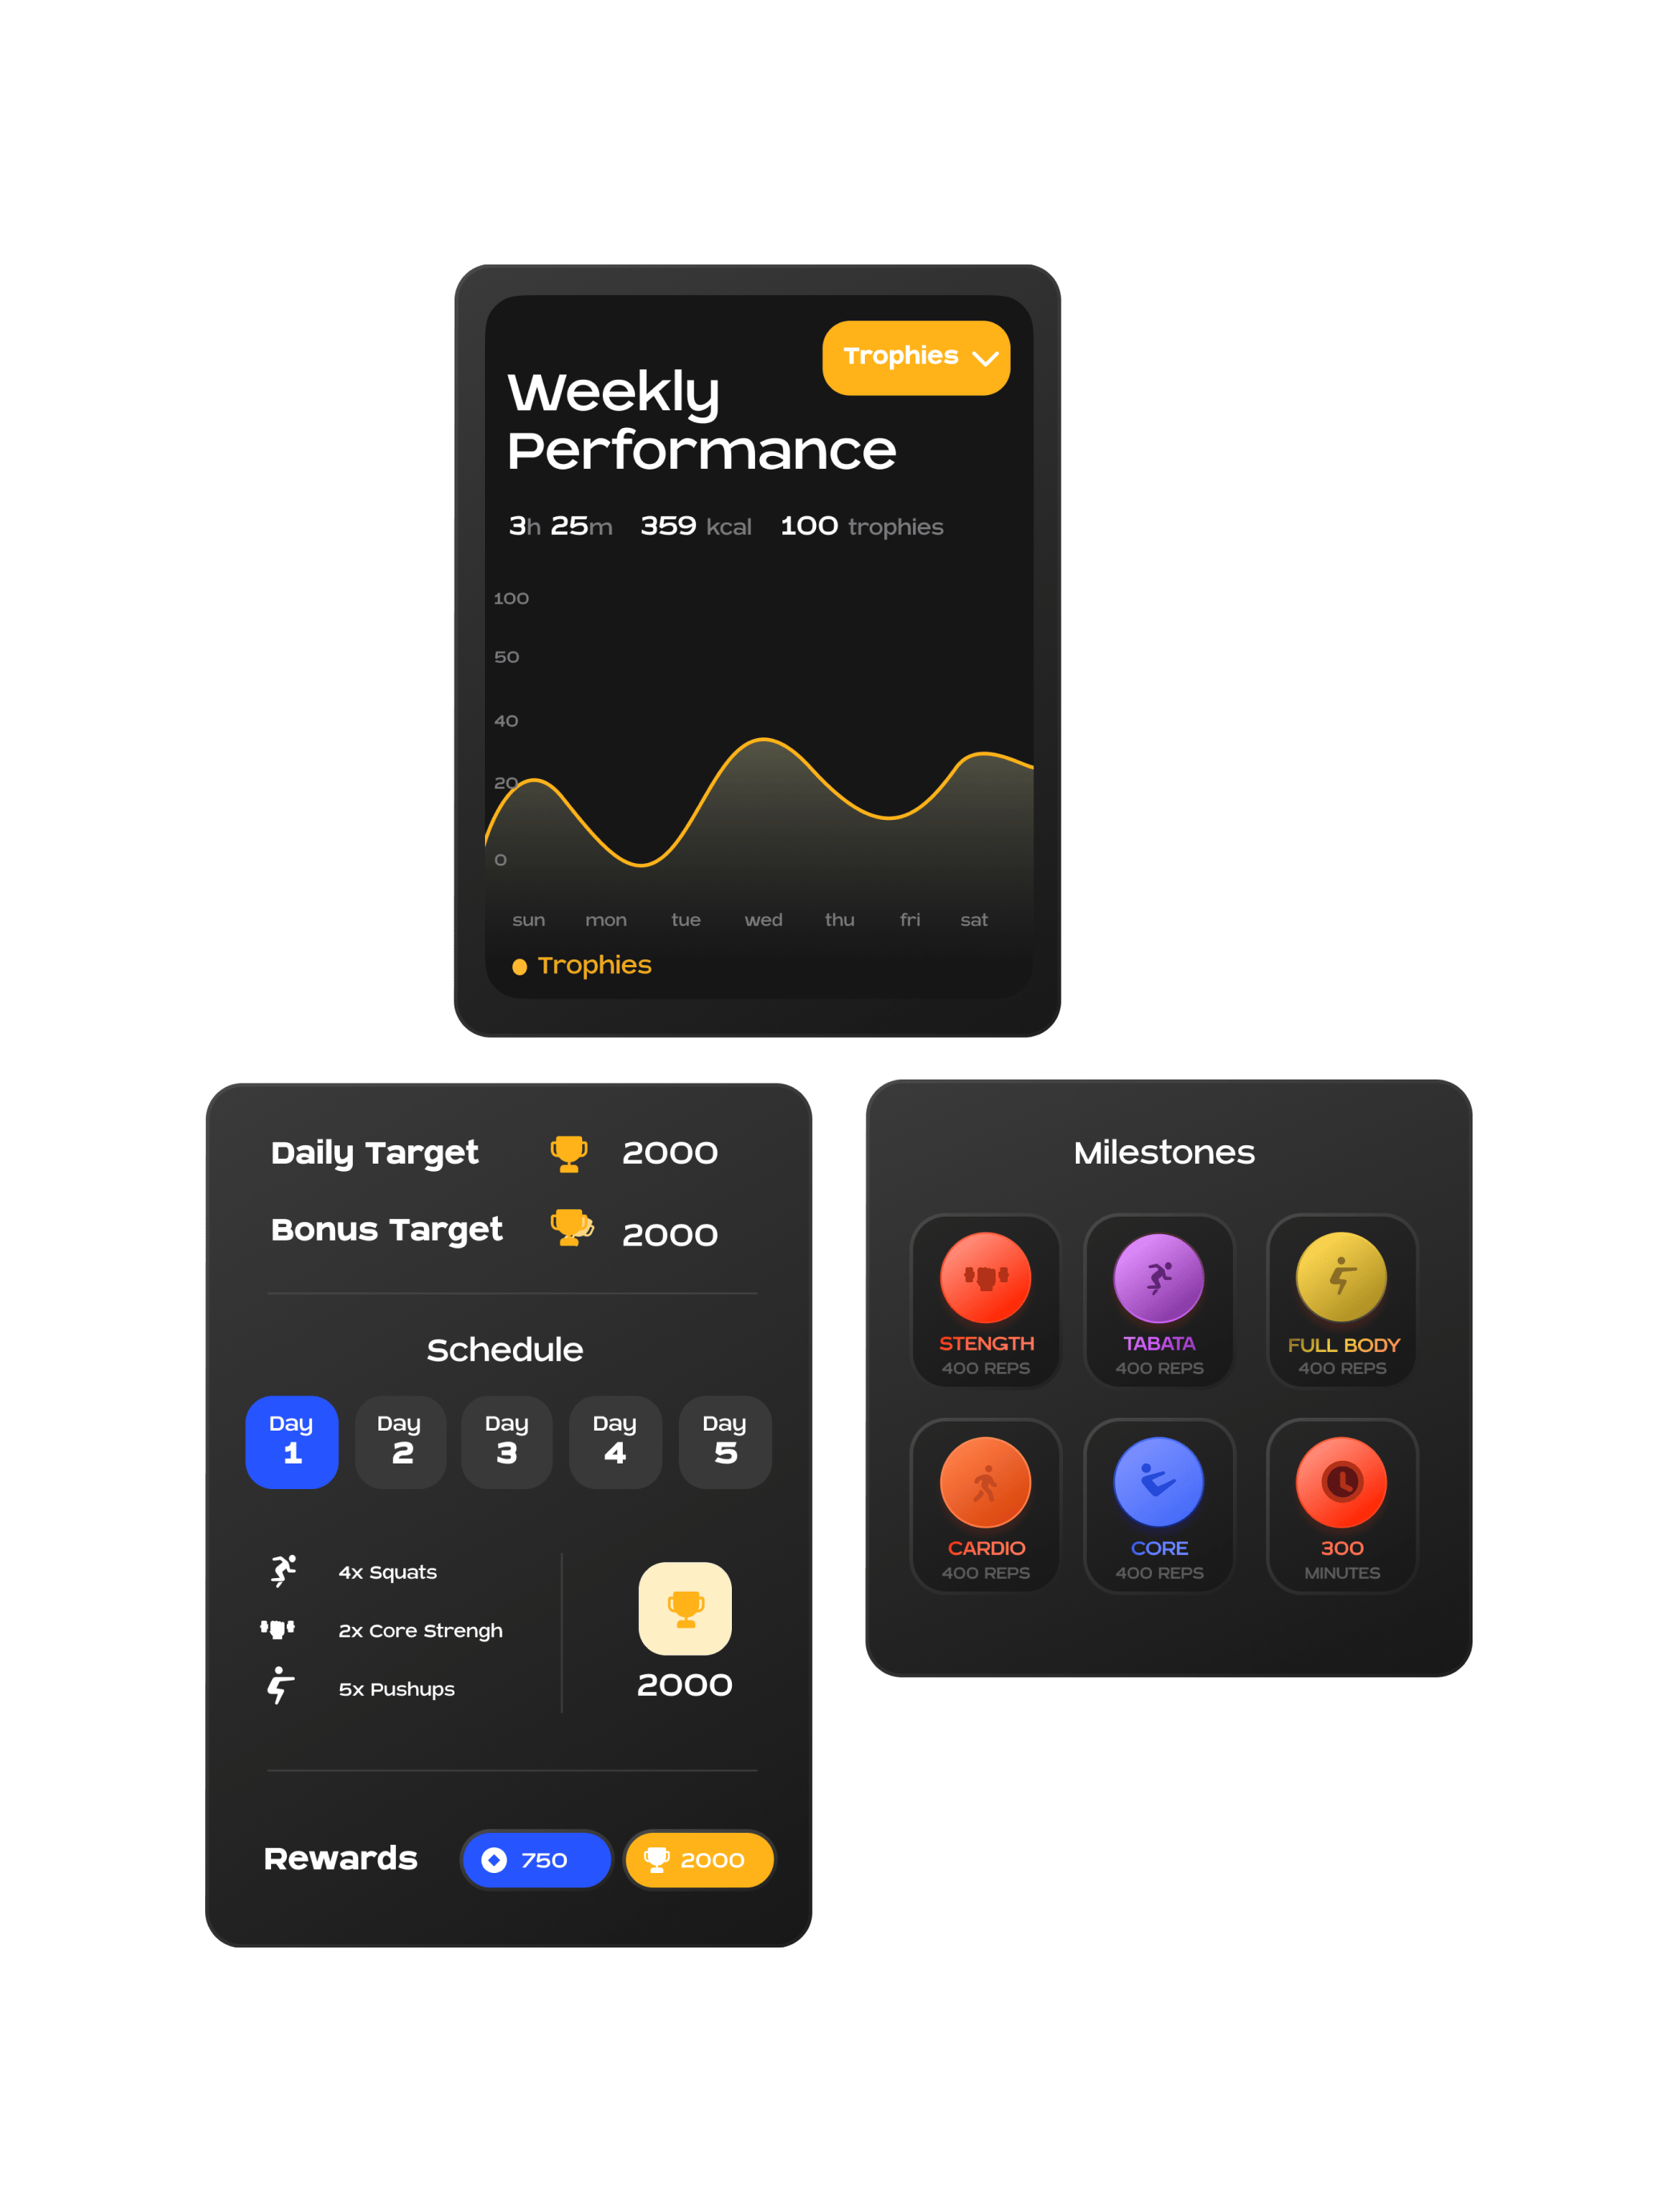
Stats & Sparklines.
Inline stat blocks, sparklines, and proportion strips — the glanceable layer used in study result summaries.
DVStatBlock
value · label · sub · delta · trend
DVSparkline
mini trend line
DVRatioStack
proportional horizontal bar
Line & Area.
Time-series and trend charts. Multi-series with annotations, single-series area, and stacked area with palette control.
DVLineChart
multi-series with annotations + legend
DVAreaChart
single-series area
StackedArea
multi-series stacked area
Bar & Distribution.
Categorical bars, frequency distributions, heatmaps. The workhorse layer for data journalism.
DVBarChart
labelled horizontal bars
DVDistribution
dot-plot distribution
Histogram
binned frequency with optional KDE
DVHeatmap
grid heatmap — rows × cols × values
Statistical.
Box plots, violins, scatter, ECDF, Q–Q, correlation matrix — the analysis layer for study reports.
BoxPlot
box-and-whisker across groups
ViolinPlot
KDE violin with IQR + median
ScatterPlot
bivariate relationship
ECDF
empirical cumulative distribution function
QQPlot
normal Q-Q plot
CorrelationMatrix
Pearson r heatmap with hatch for negatives
UX Flows.
Funnel, Sankey, node-link diagram, treemap — mapping how users move through a product or system.
Funnel
conversion funnel with % of top step
Sankey
multi-column flow diagram
DVNodeGraph
manual-layout SVG node-link diagram
Treemap
recursive slice-and-dice area map
Survey.
Likert diverging bars, NPS strip, SUS gauge — standardised UX measurement instruments rendered as composable chart components.
LikertStack
diverging Likert bar chart
NPSStrip
NPS score + proportion strip
SUSGauge
System Usability Scale gauge with zones
UX Research.
Priority matrix, task success matrix, radar, gaze plot, journey map — synthesis tools for qualitative and usability studies.
RadarChart
multi-axis polygon chart
PriorityMatrix
2x2 effort-impact matrix
TaskSuccessMatrix
pass / partial / fail / skip per task x user
GazePlot
eye-tracking fixation plot with scan path
JourneyMap
phased CX journey with sentiment curve
Retention.
Cohort retention curves and heatmap grid — the standard instrument for measuring product stickiness over time.
RetentionCurve
multi-cohort retention curves
CohortGrid
heatmap-style cohort retention table
Wrappers & Diagnostic.
Accessible chart containers, presentational frames, and ML evaluation charts — ROC curve, calibration, confusion matrix.
ChartFigure
accessible wrapper — figure + aria + visually-hidden table
DVFrame
eyebrow · title · caption · source
Reaction-time distribution
ROC curve
receiver operating characteristic with AUC
Calibration
predicted vs observed probability — circle radius proportional to bin n
ConfusionMatrix
2x2 matrix with accuracy · precision · recall · F1